C5 – Water supply industry and population connected to water supply industry in the Republic of Azerbaijan
KEY MESSAGES
In 2017, 50.9 % of the total population of Azerbaijan was connected to the public water supply, while 49.1 % of population met their water demands by self-supply.
The estimated percentage of the population connected to the water supply industry had increased by 9.3 % in 2017, compared with 2005. In absolute terms, total population connected to the public water supply network had increased by 41.6 % for the same period.
Water losses during transport has remained a major concern in the water supply sector, causing the loss of more than half of the water abstracted. It is estimated that about 47.6 % of the total water supply was lost during transport in 2017.
Is the percentage of Azerbaijani citizens with access to improved water supply services increasing?
Figure 1- Population connected to water supply industry in the Republic of Azerbaijan (2005-2017)
Data sources:
Data has been provided by the State Statistical Committee of the Republic of Azerbaijan under the ENI SEIS II East project activities
Figure 2 - Development of net volume of water supplied by water supply industry and water losses during transport in the Republic of Azerbaijan (2005-2017)
Data source:
Data has been provided by the State Statistical Committee of the Republic of Azerbaijan under the ENI SEIS II East project activities
The water supply industry provides water to the public for various purposes, such as for domestic use and drinking, and to agriculture, industry and many other sectors.
In 2017, 609.1 million m3 was supplied by the water supply system, of which 290.5 million m3 was lost in the water supply network, which corresponds to 47.6 % of total water supplied. The total water supplied slightly decreased (7.6 %) between 2005 and 2017. At the same time, net water consumption per capita substantially decreased from 150 m3/year in 2005 to 63.2 m3/year in 2017. However, because of an increasing share of water losses, the total water supplied has increased.
In 2005, only 41.6 % of the population was connected to the public water supply. As a result of investments in the transport system and the implementation of water supply projects (UNECE, 2011), the proportion of population connected to water supply system has increased by 50.9 % of the total population of the country. Meanwhile, the absolute number of people connected to the water supply has also tremendously increased from 3.6 million inhabitants in 2005 to 5 million inhabitants in 2017. However, two major issues will remaining outstandingly challenging in the near future: (1) increasing the percentage of the total population connected to the public water supply; and (2) decreasing the leakages from the transport system. Work on both of these requires to be continued, with financial and technical investments in the public water supply network.
Nevertheless, more than half of the population still need to meet their water demands by self-supply and are not yest connected to the water supply system, which keeps Azerbaijan far from reaching United Nations (UN) Sustainable Development Goal (SDG) target 6.1 of, by 2030, achieving universal and equitable access to safe and affordable drinking water for all.
Indicator specification
Indicator definition
This indicator presents the volume of water supplied to the users by the water supply industry, taking into account water losses during transport and the population connected to the water supply industry, as a total and as a share of the total population.Units
The total volume of water supplied by the water supply industry is measured in million cubic metres per year; the share of the total population connected to the water supply industry is provided as a percentage.Rationale
Justification for indicator selection
The indicator is important for defining the level of development of the water economy services and the degree of water accessibility to cover the needs of the population. The indicator also helps to identify trends in the water supply.Scientific references
- UNECE, 2011. Azerbaijan –Second Environmental Performance Review, United Nations Economic Commission for Europe, Environmental Performance Reviews Series No. 31, e-ISBN 978-92-1-117035-1, New York and Geneva.
- UNECE, 2018. Guidelines for the Application of Environmental Indicators, Description of C5: Water supply industry and population connected to water supply industry.
- UNECE, 2018. Guidelines for the Application of Environmental Indicators, Glossary of terms – C5: Water supply industry and population connected to water supply industry.
Policy context and targets
Context description
National policy context
The water code of the Azerbaijan Republic, (1997) adopted by the Law of Azerbaijan Republic № 418-IG of December 26, 1997 - The code considers internal waters of Azerbaijan. The section of the Caspian Sea (lake) belonging to Azerbaijan is part of the national wealth of the Azerbaijani people, and it is used and protected as the basis of the life and activity of the population and to ensure the existence of flora and fauna. The code regulates the legal regulations related to the use and protection of water bodies in Azerbaijan.International policy context
Sustainable Development Goal (SDG) 6 of the UN Sustainable Development Agenda for the period up to 2030 aims ‘to ensure access to water and sanitation for all’. Target 6.1 of SDG 6 is also aiming, ‘by 2030, to achieve universal and equitable access to safe and affordable drinking water for all’. Similarly, Target 6.4 states the aim to, ‘by 2030, substantially increase water use efficiency across all sectors and ensure sustainable withdrawals and supply of freshwater to address water scarcity and substantially reduce the number of people suffering from water scarcity’.Targets
National targets
No national target has been specified.International targets
UN SDG 6, target 6.4: by 2030, substantially increase water use efficiency across all sectors and ensure sustainable withdrawals and supply of freshwater to address water scarcity and substantially reduce the number of people suffering from water scarcity.Related policy documents
- The water code of the Azerbaijan Republic, (1997) Adopted by the Law of Azerbaijan Republic № 418-IG of December 26, 1997.
- Sustainable Development Goals. UN (2016). Sustainable development goals, the sustainable development agenda.
Methodology
Methodology for indicator calculation
Units and equations
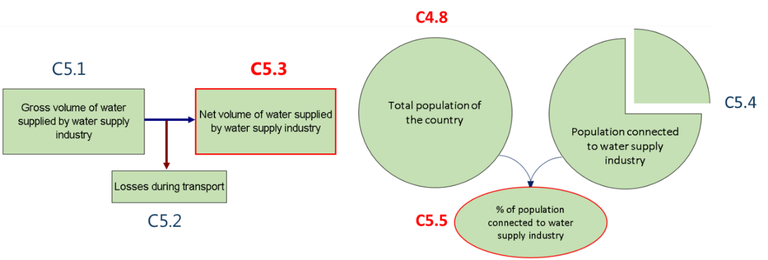
| ID | Component | Units | Equation |
|
ID |
Component |
Units |
Equation |
|
C5.1 |
Gross volume of water supplied by water supply industry (ISIC 36) |
million m3/year |
|
|
C5.2 |
Losses during transport (ISIC 36) |
million m3/year |
|
|
C5.3 |
Net volume of water supplied by water supply industry (ISIC 36) |
million m3/year |
= C 5.1 - C 5.2 |
|
C4.8 |
Total population of the country |
million people |
|
|
C5.4 |
Population connected to water supply industry (estimation) |
million people |
|
|
C5.5 |
Population connected to water supply industry |
percentage (%) |
Methodology for gap filling
No gap filling has been performedMethodology references
- EEA, 2005. EEA core set of indicators guide. EEA Technical report No 1/2005, ISBN 92-9167-757-4, Luxembourg.
- UNECE, 2018. Guidelines for the Application of Environmental Indicators, Data template – C5: Water supply industry and population connected to water supply industry.
- UNECE, 2018. Guidelines for the Application of Environmental Indicators, Description of C5: Water supply industry and population connected to water supply industry
- UNECE, 2018. Guidelines for the Application of Environmental Indicators, Glossary of terms – C5: Water supply industry and population connected to water supply industry.
- UNSD and UNEP, 2013. Questionnaire 2013 on Environment Statistics. United Nations Statistics Division and United Nations Environment Programme, Questionnaire 2013 on Environment Statistics, Section Water.
Uncertainties
Methodology uncertainty
No uncertainty has been specified.Data sets uncertainty
No uncertainty has been specified.Rationale uncertainty
No uncertainty has been specified.Data sources
Data has been provided by the State Statistical Committee of the Republic of Azerbaijan under the ENI SEIS II East project activities. However, some relevant data can be found on the below given sources:- 9.1. Main indicators characterizing protection of water resources and their rational use provided by the State Statistical Committee of the Republic of Azerbaijan
- 9.3. Main indicators characterizing water resources by types of economic activities provided by the State Statistical Committee of the Republic of Azerbaijan
Metadata
Topics: waterIndicator code: C5
Tags: water supply, population connected to water supply, water losses, Azerbaijan
Temporal coverage: 2005-2017
DPSIR: pressure
Typology: descriptive indicator (type A – what is happening to the environment and to humans?)
Dates
Publication date:Last modified:
Frequency of updates: every year
Contact and ownership
Contact: Rena Lazımova (Statistical Committee), Tural Agharzayev (Azersu OJSC)Ownership: State Statistical Committee of the Republic of Azerbaijan